
Student numbers by university
As briefly indicated on the overview page, the student numbers at the various Swiss universities have changed radically over the last forty years, although the total number of philosophy students has increased only slightly. Over the last ten years, the figures were the following:
| 2010/11 | 2011/12 | 2012/13 | 2013/14 | 2014/15 | 2015/16 | 2016/17 | 2017/18 | 2018/19 | 2019/20 | 2020/21 | 2021/22 | |
| BS | 59 | 45 | 30 | 24 | 23 | 26 | 27 | 32 | 27 | 29 | 26 | 24 |
| BE | 183 | 184 | 174 | 169 | 177 | 201 | 204 | 203 | 190 | 204 | 200 | 187 |
| FR | 163 | 144 | 149 | 151 | 155 | 164 | 172 | 178 | 173 | 176 | 158 | 161 |
| GE | 70 | 62 | 58 | 51 | 42 | 44 | 42 | 38 | 43 | 49 | 53 | 63 |
| LS | 50 | 45 | 44 | 42 | 39 | 34 | 26 | 19 | 25 | 29 | 28 | 26 |
| LU | 64 | 61 | 59 | 85 | 69 | 84 | 60 | 72 | 79 | 74 | 76 | 64 |
| NE | 26 | 20 | 21 | 22 | 26 | 28 | 29 | 26 | 27 | 28 | 24 | 26 |
| UZH | 328 | 330 | 319 | 293 | 286 | 269 | 299 | 320 | 342 | 353 | 376 | 362 |
| USI | 0 | 0 | 0 | 0 | 0 | 0 | 0 | 16 | 24 | 29 | 31 | 80 |
| Total | 943 | 891 | 854 | 837 | 817 | 850 | 859 | 904 | 930 | 971 | 972 | 993 |
On the one hand, the significant decrease in Basel and Lausanne appears interesting, on the other hand, the large increase in Lugano, where the USI and ISFI have become the fourth largest philosophy institute in Switzerland within five years.
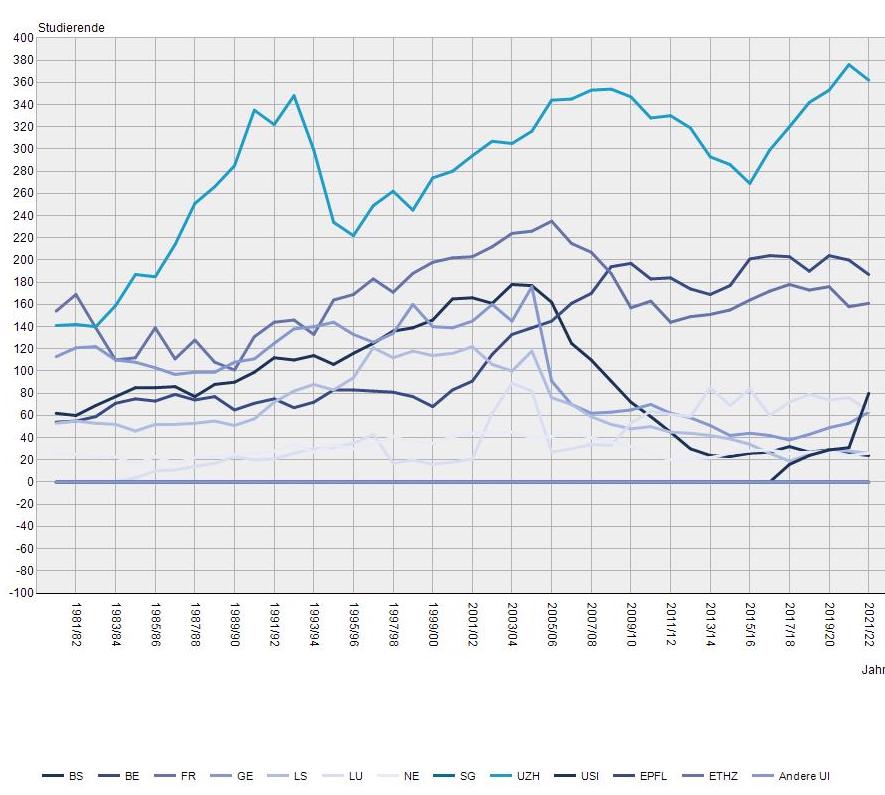
Graphically, the development of the number of students over the last forty years can be illustrated as follows (see the basic tables of the Federal Statistical Office):
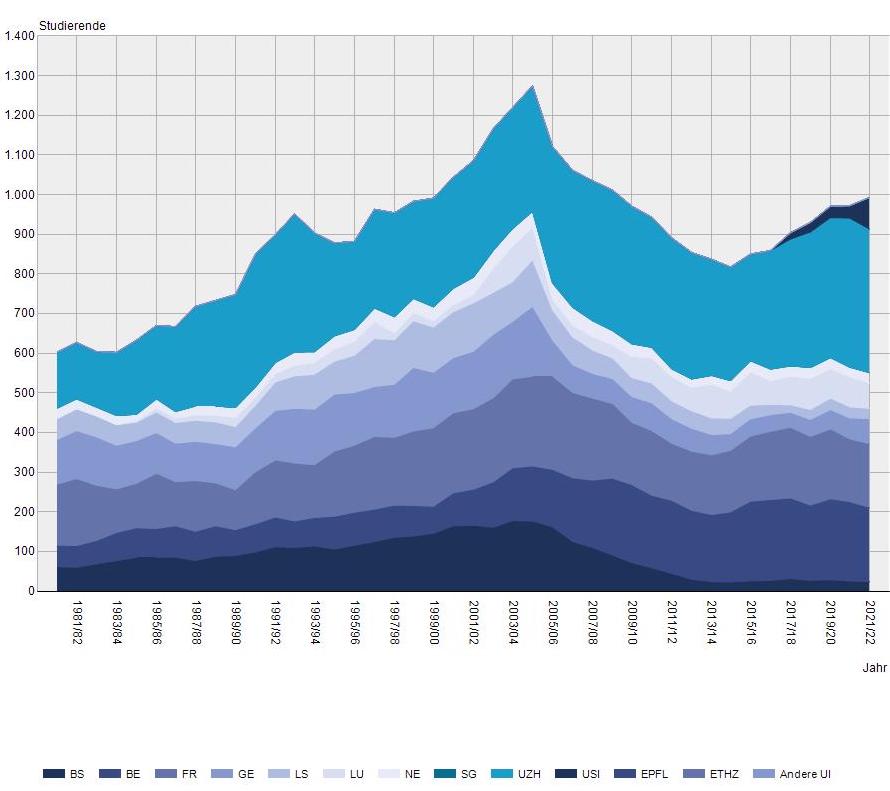
The cumulative graph clearly shows the slump in student numbers that resulted from the so-called Bologna Reform (introduction of BA/MA degree programmes and ECTS):
Degrees by year and university
Since the academic year 1980/81 and until last year, the universities have awarded the following degrees in philosophy:
- UniZH 411 Licentiates/Diplomas, 203 BA, 63 MA, 171 Doctorates
- UniFR 348 Licentiates/Diplomas, 189 BA, 75 MA, 98 Doctorates
- UniGE 252 Licentiates/Diplomas, , 96 MA, 108 Doctorates
- UniBS 221 Licentiates/Diplomas, 5 BA, 4 MA, 114 Doctorates
- UniL 216 Licentiates/Diplomas, 95 MA, 64 Doctorates
- UniBe 165 Licentiates/Diplomas, 214 BA, 199 MA, 93 Doctorates
- UniNE 66 Licentiates/Diplomas, 26 MA, 31 Doctorates
- UniLU 25 Licentiates/Diplomas, 52 BA, 33 MA, 12 Doctorates
- USI 22 MA
The figures for the University of Basel are extremely low: while the philosophy department was the fourth largest in terms of degrees before the Bologna reform, it is now by far the smallest.
Compared to the number of students, the University of Bern has a very large number of degrees, and the University of Zurich has very few. The cumulative student numbers since 2001/02 are 3621 for Bern and 6842 for Zurich, of which MA degrees account for 5.5% in Bern (i.e.: about 11% of students graduate within the standard study duration of 2 years), but less than 1% in Zurich.
The number of doctorates increased but has stabilised: in 1980-89 there were 104, in 1990-99 a total of 142, in 2000-09 195 and in 2010-19 198. The peak year remains 2005 with 30 doctorates awarded.
The female graduation rate for all titles is higher than their share of students in most years: in the academic year 2021/22, for example, the female percentage of total students was 40%, but for BA degrees it was 52%, for MA degrees 41% and for PhDs 46%.
The three universities in French-speaking Switzerland (UniGE, UniL and UniNE) do not seem to have reported their Bachelor's degrees to the Federal Statistical Office (and are probably therefore listed with "'0"). When asked, an employee of the BfS writes: "At the universities of Geneva, Lausanne and Neuchâtel, the Bachelor in Philosophy has so far been offered as a multidisciplinary degree (a consequence of the Bologna reform). For these universities, it is unfortunately not currently possible to identify the multidisciplinary bachelor's degrees with philosophy as a subject, as these are surveyed and published in the individual multidisciplinary degree programmes. However, we are in a transitional phase for some of these institutions and it is quite possible that they will offer a monodisciplinary programme for philosophy studies over time. For specific information about philosophy at these universities, we suggest that you contact them directly." To my knowledge, the BA programme in philosophy is not monodisciplinary in any single university. Perhaps there is another way to find out the number of BA degrees?
Studierendenzahlen und Abschlüsse
A comparison of degrees with student numbers (excluding BA degrees from universities in French-speaking Switzerland) shows that women are overrepresented in BA and MA degrees, but underrepresented in doctorates.
| Studierende | Bachelor | Lizenziate/Diplome | Master | % lic/MA der Stud. | Doktorat | % Dr der Stud. | |||||||||||||
| ♂ | ♀ | % ♀ | ♂ | ♀ | % ♀ | ♂ | ♀ | % ♀ | ♂ | ♀ | % ♀ | ♂ | ♀ | ♂ | ♀ | % ♀ | ♂ | ♀ | |
| 1980 | 416 | 187 | 31 | 17 | 12 | 41 | 4.09 | 6.42 | 4 | 1 | 20 | 0.96 | 0.53 | ||||||
| 1981 | 439 | 188 | 30 | 30 | 10 | 25 | 6.83 | 5.32 | 9 | 1 | 10 | 2.05 | 0.53 | ||||||
| 1982 | 424 | 180 | 30 | 39 | 14 | 26 | 9.20 | 7.78 | 9 | 2 | 18 | 2.12 | 1.11 | ||||||
| 1983 | 418 | 184 | 31 | 41 | 16 | 28 | 9.81 | 8.70 | 4 | 2 | 33 | 0.96 | 1.09 | ||||||
| 1984 | 454 | 179 | 28 | 28 | 14 | 33 | 6.17 | 7.82 | 9 | 0 | 0 | 1.98 | 0.00 | ||||||
| 1985 | 467 | 203 | 30 | 27 | 7 | 21 | 5.78 | 3.45 | 4 | 1 | 20 | 0.86 | 0.49 | ||||||
| 1986 | 463 | 204 | 31 | 32 | 16 | 33 | 6.91 | 7.84 | 11 | 0 | 0 | 2.38 | 0.00 | ||||||
| 1987 | 482 | 236 | 33 | 34 | 18 | 35 | 7.05 | 7.63 | 12 | 6 | 33 | 2.49 | 2.54 | ||||||
| 1988 | 482 | 251 | 34 | 22 | 6 | 21 | 4.56 | 2.39 | 9 | 4 | 31 | 1.87 | 1.59 | ||||||
| 1989 | 488 | 260 | 35 | 29 | 13 | 31 | 5.94 | 5.00 | 15 | 0 | 0 | 3.07 | 0.00 | ||||||
| 1990 | 563 | 287 | 34 | 21 | 15 | 42 | 3.73 | 5.23 | 14 | 1 | 7 | 2.49 | 0.35 | ||||||
| 1991 | 598 | 301 | 33 | 37 | 11 | 23 | 6.19 | 3.65 | 11 | 0 | 0 | 1.84 | 0.00 | ||||||
| 1992 | 619 | 332 | 35 | 28 | 8 | 22 | 4.52 | 2.41 | 7 | 2 | 22 | 1.13 | 0.60 | ||||||
| 1993 | 596 | 307 | 34 | 37 | 16 | 30 | 6.21 | 5.21 | 13 | 1 | 7 | 2.18 | 0.33 | ||||||
| 1994 | 562 | 316 | 36 | 30 | 8 | 21 | 5.34 | 2.53 | 6 | 4 | 40 | 1.07 | 1.27 | ||||||
| 1995 | 572 | 310 | 35 | 29 | 21 | 42 | 5.07 | 6.77 | 13 | 4 | 24 | 2.27 | 1.29 | ||||||
| 1996 | 626 | 337 | 35 | 32 | 16 | 33 | 5.11 | 4.75 | 13 | 3 | 19 | 2.08 | 0.89 | ||||||
| 1997 | 632 | 322 | 34 | 36 | 26 | 42 | 5.70 | 8.07 | 10 | 8 | 44 | 1.58 | 2.48 | ||||||
| 1998 | 652 | 331 | 34 | 30 | 21 | 41 | 4.60 | 6.34 | 12 | 4 | 25 | 1.84 | 1.21 | ||||||
| 1999 | 658 | 333 | 34 | 40 | 21 | 34 | 6.08 | 6.31 | 11 | 5 | 31 | 1.67 | 1.50 | ||||||
| 2000 | 683 | 361 | 35 | 48 | 24 | 33 | 7.03 | 6.65 | 8 | 7 | 47 | 1.17 | 1.94 | ||||||
| 2001 | 710 | 376 | 35 | 36 | 23 | 39 | 5.07 | 6.12 | 15 | 4 | 21 | 2.11 | 1.06 | ||||||
| 2002 | 764 | 403 | 35 | 37 | 19 | 34 | 4.84 | 4.71 | 13 | 5 | 28 | 1.70 | 1.24 | ||||||
| 2003 | 814 | 405 | 33 | 49 | 17 | 26 | 6.02 | 4.20 | 10 | 5 | 33 | 1.23 | 1.23 | ||||||
| 2004 | 845 | 429 | 34 | 38 | 20 | 34 | 4.50 | 4.66 | 12 | 3 | 20 | 1.42 | 0.70 | ||||||
| 2005 | 730 | 391 | 35 | 47 | 22 | 32 | 6.44 | 5.63 | 19 | 11 | 37 | 2.60 | 2.81 | ||||||
| 2006 | 678 | 383 | 36 | 5 | 2 | 29 | 42 | 20 | 32 | 6.19 | 5.22 | 11 | 3 | 21 | 1.62 | 0.78 | |||
| 2007 | 663 | 372 | 36 | 14 | 9 | 39 | 38 | 32 | 46 | 1 | 1 | 50 | 5.88 | 8.87 | 23 | 4 | 15 | 3.47 | 1.08 |
| 2008 | 645 | 366 | 36 | 20 | 12 | 38 | 53 | 36 | 40 | 12 | 3 | 20 | 10.08 | 10.66 | 11 | 5 | 31 | 1.71 | 1.37 |
| 2009 | 618 | 353 | 36 | 18 | 15 | 45 | 33 | 17 | 34 | 15 | 8 | 35 | 7.77 | 7.08 | 20 | 6 | 23 | 3.24 | 1.70 |
| 2010 | 609 | 334 | 35 | 22 | 20 | 48 | 33 | 18 | 35 | 17 | 19 | 53 | 8.21 | 11.08 | 21 | 6 | 22 | 3.45 | 1.80 |
| 2011 | 572 | 319 | 36 | 26 | 16 | 38 | 23 | 8 | 26 | 24 | 20 | 45 | 8.22 | 8.78 | 10 | 5 | 33 | 1.75 | 1.57 |
| 2012 | 559 | 295 | 35 | 23 | 13 | 36 | 19 | 10 | 34 | 26 | 23 | 47 | 8.05 | 11.19 | 20 | 9 | 31 | 3.58 | 3.05 |
| 2013 | 548 | 289 | 35 | 32 | 17 | 35 | 4 | 2 | 33 | 22 | 16 | 42 | 4.74 | 6.23 | 16 | 3 | 16 | 2.92 | 1.04 |
| 2014 | 523 | 294 | 36 | 37 | 12 | 24 | 4 | 7 | 64 | 35 | 17 | 33 | 7.46 | 8.16 | 14 | 5 | 26 | 2.68 | 1.70 |
| 2015 | 545 | 305 | 36 | 21 | 11 | 34 | 14 | 3 | 18 | 24 | 15 | 38 | 6.97 | 5.90 | 13 | 7 | 35 | 2.39 | 2.30 |
| 2016 | 537 | 322 | 37 | 26 | 19 | 42 | 24 | 11 | 31 | 4.47 | 3.42 | 18 | 4 | 18 | 3.35 | 1.24 | |||
| 2017 | 542 | 362 | 40 | 28 | 23 | 45 | 21 | 22 | 51 | 3.87 | 6.08 | 14 | 1 | 7 | 2.58 | 0.28 | |||
| 2018 | 568 | 362 | 39 | 29 | 17 | 37 | 35 | 18 | 34 | 6.16 | 4.97 | 11 | 4 | 27 | 1.94 | 1.10 | |||
| 2019 | 567 | 404 | 42 | 33 | 17 | 34 | 32 | 25 | 44 | 5.64 | 6.19 | 13 | 4 | 24 | 2.29 | 0.99 | |||
| 2020 | 579 | 393 | 40 | 37 | 22 | 37 | 32 | 29 | 48 | 5.53 | 7.38 | 13 | 15 | 54 | 2.25 | 3.82 | |||
| 2021 | 594 | 399 | 40 | 32 | 35 | 52 | 39 | 27 | 41 | 6.57 | 6.77 | 13 | 11 | 46 | 2.19 | 2.76 | |||
| total | 24504 | 13165 | 35 | 403 | 260 | 39 | 1137 | 567 | 33 | 359 | 254 | 41 | 6.11 | 6.24 | 514 | 176 | 26 | 2.10 | 1.34 |
Over the 40 years, women make up 35% of philosophy students, but 39% of BA degrees, 33% of licentiate degrees, 41% of MA degrees and 26% of PhD degrees. Each year, around 6.11% of all students graduate with an MA or licentiate (but around 6.24% of women). This is a very small number - can this really be true?